
Center for Problem-Oriented Policing
![]()
![]()
The Problem of Bicycle Theft
What This Guide Does and Does Not Cover
This guide addresses bicycle theft, first by describing the problem and reviewing the factors that contribute to it. It then identifies a series of questions to help you analyze your local bicycle theft problem. Finally, it reviews responses to bicycle theft and describes the findings of evaluative research and operational policing. It will be apparent that, despite the various responses being advocated or implemented, there are no systematic evaluations of what works to reduce bicycle theft. Addressing this is important for police practice, as the evidence base should inform decision-making regarding appropriate responses. We already know a lot and this guide outlines how such knowledge (including a portfolio of responses) can usefully inform the crime-reduction enterprise. In addition, it identifies what information you need to better understand your local problem and effectively evaluate implemented responses.
This guide refers specifically to the unlawful taking of nonmotorized pedal cycles. Bicycle theft can be further categorized into theft of and theft from bicycles. Awareness of these categories is important for understanding your local problem. Each category covers different offenses demanding different responses.
- Theft of bicycles describes the theft of a cycle frame and its components.
- Theft from bicycles describes the theft of components and accessories such as lights, seats, and wheels. As bicycles are of composite construction, they are particularly vulnerable to component theft, especially regarding “quick release” features.
Although this guide covers both forms of theft, unless otherwise stated, most of the research and practical examples focus on the prevention of theft of bicycles. This is simply because cyclists are more likely to report theft of bicycles to the police, largely to meet insurance requirements.
Bicycle theft is but one aspect of the larger set of theft- and vehicle-related problems that the police must address. This guide, however, is limited to the particular harms bicycle theft causes. Related problems and topics not directly addressed in this guide—each requiring separate analyses and responses—include the following:
- Thefts of motorcycles
- Thefts of mopeds and scooters
- Fencing of stolen property
- Burglary
- Thefts of and from motor vehicles §
- Vandalism
- Insurance fraud.
Some of these related problems are covered in other guides in this series, all of which are listed at the end of this guide. For the most up-to-date listing of current and future guides, see www.popcenter.org.
§ The International Crime Victim Survey has repeatedly found that the rate of car theft holds a strong inversely proportional relationship with the rate of bicycle theft (van Dijk and van Kesteren 2007).
General Description of the Problem
Bicycle theft is typically seen as a low police priority, its impact and magnitude often overlooked because police often consider incidents on a case-by-case basis. This picture is often misleading, however, and when viewed at the aggregate level, bicycle theft represents a much larger problem, one with harmful economic and societal effects that warrant greater police attention.1
The Rise of the Bicycle
The bicycle has become increasingly popular as a healthier and environmentally friendlier mode of transport.2 In London, for example, cycle use has increased by 83 percent between 2000 and 2007.3 In the United States, between 1992 and 2006, bicycle sales have increased from 15.3 million to 18.2 million per year (an increase of roughly 20 percent)4, §, illustrating an increase in cycle use there. While cycles enjoy the greatest share of transit options within campus towns, several major towns and cities such as Portland, Oregon, are continually improving cycling infrastructure to encourage cycling.5 Moreover, anticipating consumer demand, General Motors has developed the Flex-Fix® system,6 a retractable bicycle rack that is hidden in a car’s bumper. These changes in bicycle usage and provision have been influenced in recent years by the following:
- Increased awareness of the detrimental effect of automobile carbon dioxide emissions, and pursuit of air quality and emission reduction targets
- Concerns over growing traffic congestion and accompanying noise pollution
- Rising levels (and fear) of obesity and heart disease
- Recognition that most trips are relatively short, or “bike-sized” §§
- Savings in road maintenance and improvement of street infrastructure
- Responses to policies such as charging fees to alleviate traffic congestion.
§ According to the National Bicycle Dealers Association, in 2006 the United States bicycle industry was estimated to be valued at $5.8 billion.
- §§ Gardner (1998) uses the term “bike-sized” to refer to the relatively short average urban-trip distance. For example, the U.S. Department of Transportation found that in metropolitan areas, 49 percent of all trips are shorter than 3 miles, 40 percent are shorter than 2 miles, and 28 percent are shorter than 1 mile.
Several studies suggest that fear of cycle theft may discourage bicycle use,7 and that many bicycle theft victims do not buy a replacement.8 Combating bicycle theft, therefore, is a necessary step toward increasing the use of this sustainable form of transport, an increase that unexpectedly may also improve cyclist safety. To elaborate, a recent international review of programs to encourage walking and cycling found strong evidence indicating that as the number of cyclists and walkers increased, the frequency of collisions between those groups and motorists actually decreased. The authors concluded that an effective means of improving the safety of cyclists and walkers is therefore to increase the numbers of people cycling and walking.9 Despite this, little attention has been paid to the prevention of bicycle theft. Car theft has received much more attention, for example, yet according to data collected as part of the International Crime Victim Survey, for all countries for which data were available (including the United States), bicycle owners are far more likely to have their bikes stolen (4.7 percent) than car owners their cars (1.2 percent) and motorcyclists their motorcycles (1.9 percent).10
Bicycle Theft Data
Understanding the problem of bicycle theft is hampered because police data typically underrepresent the problem. This is illustrated by data from the International Crime Victim Survey (2000), which show that across the 17 countries surveyed (including the United States), on average only 56 percent of bicycle thefts were reported to the police.
U.S. crime statistics are collated using both National Crime Victim Survey (NCVS) data from a yearly national survey, and data recorded by the police. Comparing the two data sources highlights the problem of underreporting. For example, in 2004, bicycle theft accounted for 3.6 percent of all incidents of larceny (Federal Bureau of Investigation, 2005), which equates to more than 250,000 bicycles stolen each year. According to an estimate from the NCVS, in 2006 the number of incidents of theft-of or theft-from bicycles was more like 1.3 million (just under 2.5 incidents per minute).§ This suggests that for every crime reported, another four (or more) may have occurred.
§ Using data collected from a range of sources, the Transportation Alternatives web site estimates the figure to be much higher, at more than 5 million per year (www.transalt.org/press/magazine/965SepOct/06-7you-lock.html).
Interviews with bicycle theft victims indicate that underreporting is largely due to victims’ belief that the police are not interested in bicycle theft and cannot do anything about catching the offender and returning the stolen bicycle.11 A further reason for an underrepresentation of the problem is that police departments record bicycle theft in different ways that, however inadvertently, may serve to conceal the full scope of the problem. For example, police may record a bicycle theft as a burglary from a residential property.
Clearance Rates
Clearance rates for bicycle theft remain consistently low. In the United States, 18.3 percent of incidents of larceny-theft were cleared by arrest,12 but this figure (which includes all categories of larceny) is likely to be a gross overestimate of the arrest rate for bicycle theft. For example, in Sweden, only 1 percent of bicycle thefts are cleared by arrest.13 One reason for this is that there typically exists little relationship between the victim and the offender, and hence it is difficult to identify suspects.14 Bicycle theft is also largely a crime of stealth, or one that goes unnoticed or unchallenged.15 A further problem is proof of ownership. As will be discussed below, even when crimes are reported to (and recorded by) the police, the majority of bicycle owners cannot supply sufficient details to assist in an investigation. As a consequence, even when an offender is detained for cycle theft, if the owner cannot provide proof of ownership for the retrieved cycle, then the suspect may be released without charge and may be given the stolen bike on release. Addressing the proof-of-ownership problem is important to alleviate storage costs for recovered bikes and improve the process of bicycle identification, recovery, and reunification with legitimate owners. Attempts to address this are documented in the “Responses” section below.
Offenders
Not all bicycles are stolen for financial gain. Some offenders may take a bicycle simply to get from one place to another, and then abandon it. Research suggests that the motivations of bicycle thieves can be categorized in the following way:16
- To joyride — those who steal any type of bicycle for transportation and/or enjoyment. These offenders generally abandon the stolen bicycle after use. Younger offenders (16 and under) typically fit this group.17
- To trade for cash — those who exploit easy opportunities to steal any type of bicycle and trade it for cash or goods (such as drugs).§
- To fill a request — those who steal specific types of bicycles to order.§§
- § Interviews with drug-addicted bicycle thieves in Holland found that bicycle theft is often a source of income for drug purchases (van Kesteren and Homburg 1995).
- §§ Interestingly, Nuttall (2001) suggests volume offenders are undeterred by bicycles locked together, and often will steal the attached bicycles and remove the chain later.
Understanding what types of offenders steal bicycles in your area can inform your approach to crime prevention. Unfortunately, low clearance rates for this type of crime make it difficult to gather detailed information on active bicycle thieves. Available evidence does indicate, however, that the majority of offenders are male and below the age of 20.18 Moreover, an examination of the frequency with which bicycles are abandoned can provide useful insights into offenders’ motivations. For example, in a bicycle theft study in Ellensberg, Washington, police recovered 25 percent of stolen bicycles, suggesting that around 25 percent of bicycles were probably stolen by “joyrider” offenders.19 In a Dayton, Ohio, police initiative, the problem was reversed, with approximately 80 percent of stolen bicycles being recovered, suggesting that many more offenses were committed for the purposes of transportation or enjoyment than for financial gain.20
It is important to be aware that victims and offenders may not always represent distinct groups. For example, studies suggest that victims of bicycle theft sometimes either steal bicycles themselves to compensate for their loss, or knowingly buy bicycles that are themselves stolen.21 This type of pattern illustrates a concept referred to as a crime multiplier, whereby one offense leads to the commission of several others. These offenses may include the fencing or receiving of stolen goods. Thus, a single bicycle theft does not necessarily equate to one offense, but may lead to a series of related crimes.
Recovery Rates
As noted above, not all stolen bicycles are sold for financial gain. The police recover many of them. Nonetheless, few recovered bicycles are returned to their rightful owners, often because of the proof-of-ownership problem. Surveys indicate that most cyclists do not know their bicycle serial number, nor can they provide legal evidence of bicycle ownership, such as a purchase receipt.22 As a result, the police cannot return many recovered bikes to their owners and, instead, store them until they can be checked as roadworthy and donated to charity or sold at auction. This can occupy police time and storage facilities that could be better used.
Where Does Bicycle Theft Occur?
The location of bicycle theft varies, with each location requiring separate analysis to best inform your response. Common locations include the following:
- In and around the victim’s home
- In and around the victim’s workplace
- In public space, such as bicycle-parking facilities
- At risky facilities § like university campuses and railway stations.23
- § See Problem Solving Tools Guide No. 6, Understanding Risky Facilities.
Research indicates that most bicycles reported stolen are taken from on or near the premises of the victim’s home (including garages and sheds),24 or from outside of shops or recreational facilities.25
Bicycle theft is not limited to such locations and will vary across different locales. For example, a study conducted in Belgium reported that almost no bicycles were stolen from the victims’ homes.26 For this reason, careful analyses of bicycle theft locations are required to determine whether your local problem clusters around certain risky facilities.27 Two such facilities often cited are university campuses and transit system hubs.28 At university campuses, which often contain long-stay domiciliary parking, it is likely that there will be a large proportion of high-performance and expensive bicycles that attract bicycle thieves.29 Railway stations, although less common in the United States than in Europe, have similarly been found to attract or generate bicycle-related crime. Data the British Transport Police collected showed that theft and damage to bicycles had risen by 67 percent between 1999 and 2005. All other forms of theft and criminal damage at railway stations had fallen over the same period, indicating that the growing problem of bicycle theft at these locations was not part of a more general trend.30 This has potential implications concerning the public use of such transit systems, as research indicates that victimization and fear of crime are major detractors from the use of public transit.31
In the United States, other types of public transit terminals (e.g., subway stations) may equally attract bicycle theft, and riders should be alert to this possibility. Public transit nodes may merit particular attention simply because commuters' routine activities mean that they are likely to park cycles in or around such facilities for long periods throughout the working day, leaving them unattended and hence vulnerable to theft. More generally, determining which sites account for a disproportionate amount of your local problem will allow you to better define your problem and implement a more targeted and effective response.
Repeat Victimization§
Unlike research concerned with other types of crime such as burglary,§§ few studies have considered the extent to which cycle-theft victims are repeatedly victimized. A Dutch survey32 found that across a range of crime types, including burglary, assault, and bicycle theft, victimization rates were highest for bicycle theft, and prior victimization was associated with the likelihood of further incidents of bicycle theft. Data generated by a small survey conducted in Melbourne, Australia, are also informative.33 A simple reanalysis of the data revealed that 30 percent of the bicycle-theft victims interviewed accounted for 60 percent of the crimes reported; that is, a small number of victims accounted for a large proportion of the problem.
When police identify repeat victimization as a problem in an area, they can usefully focus crime reduction efforts on those people who have recently been victimized a number of times. Determining why such people are repeatedly victimized can provide insight about your local problem and about possible solutions. Thus, collecting suitable data to enable you to identify repeat victimization will help you to understand your local problem better.
§ See Problem-Solving Tools Guide No. 4, Analyzing Repeat Victimization.
§§ See Problem-Specific Guide No. 15, Burglary of Retail Establishments, and No. 18, Burglary of Single-Family Houses.
Extending this concept, research concerned with other types of crime such as burglary (in the United States and elsewhere) and vehicle crime shows that following a victimization at one location, not only is the same victim at an elevated risk in the near future, but so too are others nearby.34 This research is important because it provides further insights into when and where crimes are likely to occur. In the absence of research of this kind concerned with bicycle theft, we conducted an analysis for this guide using police data for the county of Dorset, England. The results were consistent with those for burglary and vehicle crime, indicating that when a bicycle is stolen from one location, further incidents are more likely to occur nearby and up to a distance of about 450 yards for a period of around 3 to 5 weeks.§ Such findings, where they exist, can help inform crime prevention and detection strategies.
§ More details of this study are available from the authors upon request.
Perpetrator Techniques
Offenders use a number of techniques to steal bicycles. The technique an offender uses will often be directly linked to the cyclist’s locking practices (i.e., the type of lock the cyclist uses and the way he or she applies it). When the bike is unlocked or poorly secured, little skill is required. Some common perpetrator techniques used to steal locked bikes are described here. A one-page summary of these and the locking techniques that cyclists can use to counteract them can also be found at www.bikeoff.org.
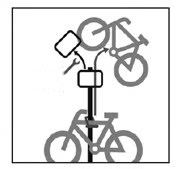
Lifting — Thieves lift the bike and lock over the top of the post to which the bike is secured. If it is a signpost, then the thieves may remove the sign to lift the bicycle clear. Sometimes the post itself is not anchored securely and can be lifted clear of the bike and the lock.
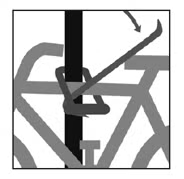
Levering — Thieves will use the gap between the stand and the bike left by a loosely fitted lock to insert tools such as jacks or bars to lever the lock apart. Thieves will even use the bike frame itself as a lever by rotating it against the stand or other stationary object to which it is locked. Either the bike or the lock will break. The thief doesn’t mind which—after all, it’s not his or her bike!
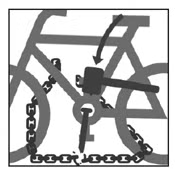
Striking — If a cyclist locks a bicycle leaving the chain or lock touching the ground, thieves may use a hammer and chisel to split the securing chain or lock.
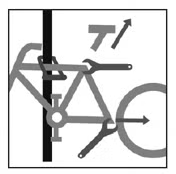
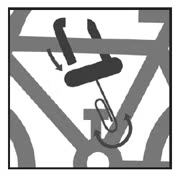
Unbolting — Thieves know how to undo bolts and quick-release mechanisms. If a cyclist locks a bike by the wheel alone, then it may be all that is left when the cyclist returns. If a cyclist locks only the frame, then a thief may remove a wheel or wheels. In this case, if a cyclist leaves a wheel-less bike with the intent of picking it up later, then the thief may return before the cyclist returns and remove the rest of the bike.
Cutting — Thieves are known to use tin snips, bolt cutters, hacksaws, and angle grinders to cut their way through locks and chains to steal bicycles.
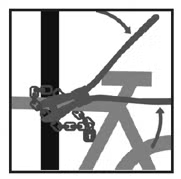
Picking — For locks requiring keys, thieves can insert tools into the keyhole itself and pick the lock open.
A consistent finding is that most stolen bicycles, regardless of theft location, are either not locked at all or are secured using a lock that requires little force to break or remove.35 While it has been proposed that all locks can be overcome if the opportunity is present and the offender is suitably equipped,36 it is clear that inadequate locking practices will create a situation conducive for the offender, and that observing more-secure locking practices should, at the very least, reduce opportunistic crime.§
§ Anecdotal evidence suggests that offenders use bolt cutters and nail guns, and some may even spray a solid lock with Freon, which essentially reduces it to a lump of ice that can be destroyed with the tap of a hammer (see Hendra 2001).
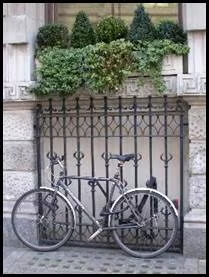
In cases where a cyclist locks only one part of the bicycle, an offender may exploit the opportunity to steal the rest of the bike (an example of such locking practice is shown below). At the University of Wisconsin (1991), for example, for 22 percent of cycle thefts, only the lock and secured wheel remained at the crime scene.37 This is important to consider because research suggests that offenders often strip bikes for parts rather than sell them whole.38 One offender reported that when selling stolen bicycles, he would get 10 percent of the list price for a whole bike, but 25 percent of the list price for individual parts.39 So stealing only parts of a bike may require the least effort and, if the right parts are stolen, attract similar rewards to stealing the whole thing.
Factors Contributing to Bicycle Theft
The following section outlines factors that contribute to bicycle theft. Understanding these factors will help you frame your local analysis questions, determine good effectiveness measures, recognize key intervention points, and select appropriate responses.
The CRAVED Bicycle
Bicycle theft is a good example of an opportunistic crime. Some of the reasons for this are encapsulated by the acronym CRAVED, which outlines why bicycles are attractive targets for theft.40 Bicycles are the following:
Concealable—Most thieves will look inconspicuous riding away on a stolen bicycle, which effectively makes the crime concealable. In addition, offenders steal many bikes from public places where passersby conceal the theft, as illustrated in the film Bike Thief, which explores cycle theft in New York City.§
Removable—If poorly locked, bicycles are easy to take and ride away. In other cases, quick-release features such as wheels or seat posts that are not appropriately secured require little effort to steal.
Available—Increased bicycle ownership and use provides more opportunities for theft and a greater demand for bicycles and replacement parts. In addition, poor locking practices by cyclists ensure a constant supply of available targets.
Valuable—Bicycles are not cheap. The average cost for a mountain bike ranges from $330 to $400,41 with some costing thousands of dollars.42 In the Ellensburg study, it was found that police were less likely to recover expensive bikes than to recover cheaper ones.43
Enjoyable—Many thieves steal a bike simply because they want one. This may be to replace one that was stolen from them, or just for pleasure. Analysis of British Crime Survey data showed that the risk of theft for “sporty” bicycles such as mountain bikes or BMXs was twice as high as that for “ordinary” bicycles.44
Disposable—Thieves can easily sell stolen bikes, either “whole” or “piecemeal,” to a fence or through other outlets (such as online auctions). Evidence suggests many thieves want to sell stolen goods quickly to reap a financial profit.45 Abundant “buyer’s” markets for stolen bikes may therefore provide an incentive to steal. Regrettably little is known about the market for stolen bicycles, but the proof-of-ownership problem suggests few bicycles could easily be identified as stolen, which aids the sale of stolen bikes and reduces the risk of apprehension and identification. Moreover, offenders can disguise stolen bicycles by painting different parts, altering components, or scratching any property-marking etchings, making positive identification harder.46 One prolific offender reported that bicycles or parts may be stolen to order, but systematic evidence of this is unavailable.47
§ Bike Thief, Neistat Brothers, New York, 2001.
Consideration of the CRAVED acronym can help to identify potential intervention points—particularly the mechanisms by which a proposed response is intended to work. This is discussed further in the “Responses” section.
Parking
The term “parking” refers to bicycles’ being left unattended. The “parking” event is described by the following combination of factors which influence the risk of theft:
- Lock type (if any)
- Locking practice (how a cyclist applies a lock)
- Flyparking
- Parking furniture (what a bicycle is locked to)
- Parking environment (situational considerations relating to the site where the parking furniture is located).
Lock type. Research on motor vehicle theft48 demonstrates the crime-reduction effects of improved locks, particularly immobilizers. While it is uncommon for security features to be integral to bicycle design (for a welcome exception, see the Puma bike below), locks may reduce the vulnerability of parked bikes. The type of lock a cyclist uses is paramount. Weak locks are unlikely to deter offenders, so it is important to determine whether the types of locks victims of bicycle theft typically use could be part of the problem. For example, as part of the work one of the authors is conducting, visual audits of a series of areas in the United Kingdom revealed that cyclists were using locks that were of very poor quality and easily removable.
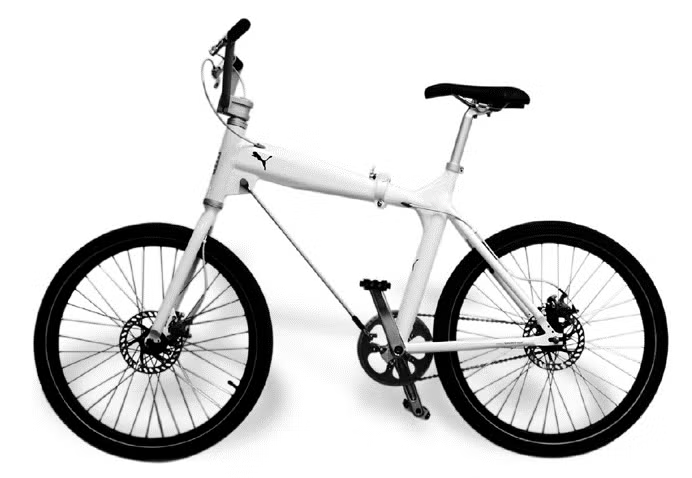
§ Designed by Adam Thorpe, Joe Hunter, and Jens Martin Skibsted, the Puma bicycle has two integral features that facilitate secure parking. First, the bicycle can be folded, allowing both wheels and the frame to be secured. Second, the diagonal section of the bicycle frame is made from steel wire rather than metal tubing. This is so the wire can be detached from the upper part of the frame, threaded through the wheels, and then locked to secure the bike. If cut, the bicycle’s structural integrity is compromised, rendering the bicycle unusable.
By current standards, a lock is considered “secure” if it can withstand an attack lasting 3 minutes or more by a thief using readily available hand tools.§ Some robust locks are sold with insurance guarantees for the bicycles they secure. Different types of locks are vulnerable to different theft-perpetrator techniques. For maximum security, cyclists are advised to use two locks of different types. This means that a would-be thief must use two different tools to “break” the locks, thereby increasing the associated effort. Determining whether cyclists in your area use poor locks may inform intervention approaches. Appendix B lists several generic lock types that are readily available and currently in use.
§ Evaluation of lock security is available online at www.soldsecure.com.
Locking practice. Research has shown that there are 180 possible locking configurations to secure a traditional two-wheeled bicycle to a standard Sheffield or “∩” shaped bicycle stand (a design commonly used).49 Defining “secure locking” as the application of an appropriate lock or locks to secure a bicycle’s wheels and frame to a stand, the researchers found that 109 of these combinations were categorized as “bad” or insecure, 48 as “OK” or semi-secure, and just 23 as “good” or secure.
In the same study, observations of around 8,500 London bicycle-locking events found that in 87 percent of cases, cyclists used only one lock, 19 percent locked only their frame to the stand, and just 20 percent locked them in a way considered “secure.” Similar results have been reported elsewhere.50 Such findings indicate that the use of adequate locks alone may be insufficient to prevent bicycle theft if application of those locks is generally inadequate. It is hence wise to conduct visual audits of cyclists’ locking practices to see if they are locking their bikes appropriately.
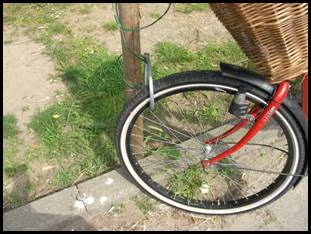
Flyparking. Bicycles may be “flyparked,” the term coined by Adam Thorpe to describe the securing of bicycles to street furniture not intended for that purpose. Cyclists may flypark bicycles to railings, lampposts, parking meters, benches, street signs, and even trees.51 Flyparking is important for understanding your local problem, for several reasons. First, street furniture not designed for bicycle parking will not be fit for the purpose. For example, if a cyclist locks a bicycle to a signpost, it is likely that he or she will secure only one part of the bicycle, and in many cases the bicycle will therefore be easily removable. Flyparked bicycles may therefore be at greater risk than those secured to street furniture designed with crime prevention in mind.§ Indeed, in Camden, London, local police data indicate that of all bicycles reported stolen between 2004 and 2005, 72 percent were flyparked.52
§ Note that not all cycle stands are designed the same way, so care needs to be taken when selecting street furniture.
Flyparking may be seen as an indicator of insufficient or inadequate bicycle parking provision. Provision, however, should not be thought of solely in terms of the number of parking spaces available. Research suggests that if parking is more than 150 feet from the destination it is intended to serve, then it is more likely to be underused.53
Further to the design and location of bicycle parking, maintenance is important. Research suggests that damaged or abandoned bikes or locks left around stands may signal offenders as to where it is safe to steal (the broken bike effect).§,54 Cyclists are also less likely to park their bicycle near damaged or abandoned bicycles or stands, which can lead to an increase in proximate flyparking. For these reasons, it is worth reviewing bicycle parking facilities in your area to see if they are being properly maintained. Where they are not may suggest a point for intervention.
§ This refers to the similar effect proposed in the broken windows theory (Kelling and Wilson 1982).
Parking furniture. In public spaces, cyclists may park bicycles against a bicycle stand designed and provided for that purpose. These stands typically offer greater security. There are numerous stand designs available for installation. Choosing the appropriate type of bicycle-parking furniture requires accurate understanding of the local context of use and abuse. When considering parking facilities or reviewing the adequacy of those currently provided, there are many factors that you should consider (e.g., type and design of stand, provisions for short- and long-stay users, location, and interstand spacing). Instead of listing here all the factors that you might consider, the authors recommend interested readers review a series of standards that summarize what current research suggests are important, available at www.bikeoff.org.
Parking environment. Parking environment describes the context surrounding the bike-parking furniture provided, including considerations such as the following:
- Access
- Length of stay
- Lighting
- Surveillance
- Guardianship §
- Signage regarding appropriate use of the facility and locking practices
Maintenance and servicing.
§ Zhang, Messner, and Liu (2007) found a lack of guardianship around the home significantly increased the risk of bicycle theft in urban China.
Bicycle theft-prevention measures may include alterations or adaptations to any of these features of the wider parking environment. Routine Activity Theory55 and the associated crime triangle, which consider how the convergence in time and space of motivated offenders, suitable targets, and the absence of capable guardians influence the likelihood of crime, may provide a useful framework for analyzing the likely contribution of these different factors and how you could manipulate them.
For example, ensuring that supply of bicycle parking meets demand (in terms of location, number of spaces, and level of security) means that suitable targets may be reduced (e.g., fewer flyparked bicycles), and police agencies can better target crime-prevention measures and promote good locking practice (as well as potentially save time removing bikes that are parked where they shouldn’t be!). The provision of appropriate bicycle parking does not rest solely with the police, but rather with town planners, architects, and related agencies. Planning for the provision and installation of bicycle parking therefore requires consultation with such parties.
Policy Changes
Policy changes (government or otherwise) can affect cycle use and the opportunities for bicycle theft. For example, to encourage cycling in New York City, around 500 bike racks are being installed per year as part of the city’s plan to have 600 kilometers of bike lanes operational by 2009.56 Policy-driven measures such as traffic congestion fees, recently implemented in London to reduce the number of cars on the road, may increase cycle use and hence the population at risk of theft. Such measures are currently being discussed as possibilities for use in U.S. cities.57
As a different kind of example, a U.K. rail provider has prohibited bicycles from being taken on board trains, which may result in an increase in cycle parking (including flyparking, if demand outstrips provision) at train stations, and hence increased opportunities for cycle theft. Conversely, certain buses are now fitted with bicycle racks to encourage the use of cycles along with bus transport. Moreover, many communities have invested heavily in bicycle paths to promote cycling and reduce automobile dependency.58 Awareness of such measures and anticipation of the potential effects on crime may assist in proactive bicycle-theft prevention.
Seasonal Effects
Bicycle use and bicycle theft can exhibit strong seasonal patterns, depending on the particular area and users.59 In the United States, bicycle theft generally peaks during the warmer months of June, July, and August, with usage in August almost doubling that in December.60 It is important, however, to be aware of local differences in understanding your local problem. For example, the university town of Cambridge, England, where cycling is very popular, witnessed a large peak in bicycle theft in October, which exceeded that expected on the basis of general seasonal trends.61 This rise coincided with the start of term for students at the University of Cambridge. Similar patterns are observed at U.S. universities.62 You can gain knowledge of the disproportionate rate of bicycle theft in different months and places by analyzing local police data, and then can better frame an effective response in terms of where and when to implement a crime reduction scheme.
![]()
![]()
Free Bound Copies of the Problem Guides
You may order free bound copies in any of three ways:
Online: Department of Justice COPS Response Center
Email: [email protected]
Phone: 800-421-6770 or 202-307-1480
Allow several days for delivery.
Email sent. Thank you.
Bicycle Theft
Send an e-mail with a link to this guide.
* required
Error sending email. Please review your enteries below.
To *
Separate multiple addresses with commas (,)
- Your Name *
Your E-mail *
Copy me
Note: (200 character limit; no HTML)
Please limit your note to 200 characters.